The first 2 steps outlined here are the basic starting steps for any scan with FracLac.
In Steps 1-4, you do a standard box count using the default settings and a given test image.
Step 5 helps you interpret the results.
The total time required varies. You can probably expect to spend about 10 minutes reading, but the time to work through it all depends on how many outward links you choose and the speed of your computer, as the suggested test image is relatively large and can take a few minutes to scan on slower machines.
You may find useful the FAQ at the end of this tutorial, the next page, which describes the options available for a Standard Box Count scan, and the section on Interpreting Results.
-
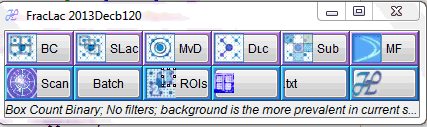
Start FracLac.
-
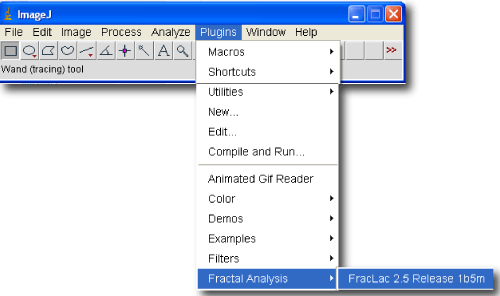
With FracLac installed, select Plugins> Fractal Analysis from the ImageJ menu
 .
.
- The FracLac panel and a colour selection tree appear. Ignore the colour selection tree for now.
-
With FracLac installed, select Plugins> Fractal Analysis from the ImageJ menu
-
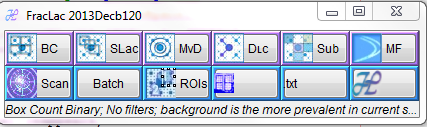
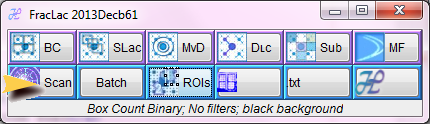
Select a Scan On startup, the panel has purple buttons for selecting the type of scan you want to do.
- If you are not here to do the tutorial for a Standard Box Count, find the purple button on the screenshot on this page for the type of scan you want to learn about, and click. Farewell, enjoy! If you are here to do the tutorial in full, however, don't click away from this page. Instead, click the top, purple button that says "Standard Box Count" on your actual FracLac panel to bring up your options.
- You may also want to learn more about the different scans available by going to the tutorials.
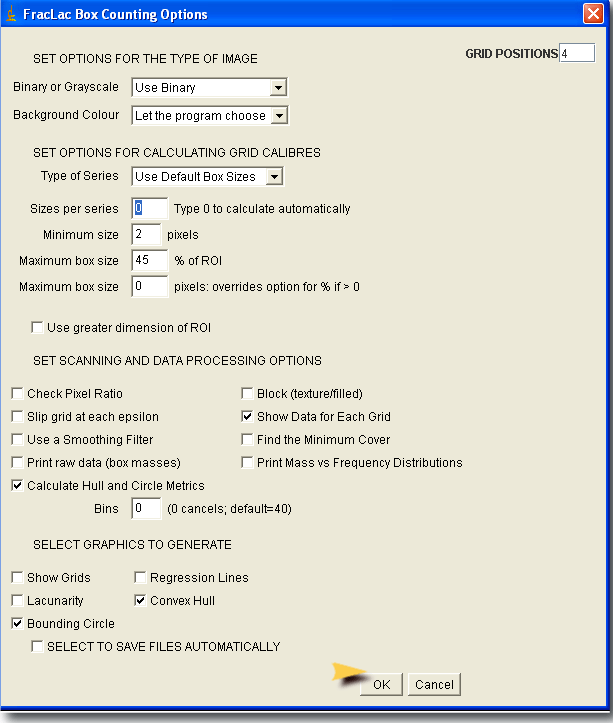
- Set Options. After you click the purple button, we are going to use the default settings, so all you need to do is click "OK" at the bottom of the options screen (as shown by the arrow below on the screenshot).
- Run the Scan. The options screen will disappear, and the FracLac panel will reappear, this time with blue buttons in the middle third (illustrated in the following steps), indicating FracLac is ready to scan.
- A test image is available, but you can use any binary image to complete the tutorial. Right click the test image icon to save the test image to your desktop.
- Open the test image in ImageJ by either using the File » Open command or dragging and dropping the file onto ImageJ.
- Make sure that the type of scan is set to Binary, then scan the test image by ensuring the test image is "active" in ImageJ (do this by clicking on the open image) then clicking the blue scan button on the FracLac panel as shown below.
- NOTE: The blue buttons are hidden when FracLac first starts, but after the first scan type has been selected, they appear and remain.
- Results. Interpret the data and graphics files showing the results of your scan.
You may also be interested in the tutorial on saving results automatically and manually.
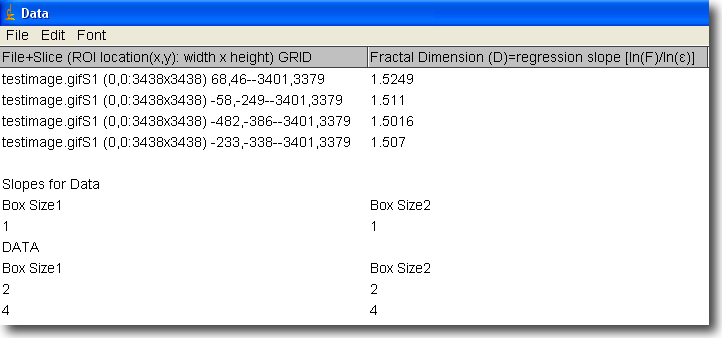
- When the scan is done, a Data results window with an upper and a lower section appears. The upper 4 lines of data correspond to 4 grid locations. The number of locations (4) was set by default in the options panel during Step 3 (see the top right corner of the image of the options panel); each actual location is selected based on the four corners of the rectangle enclosing the image, then if more than 4 orientations are used, these are randomly selected by the program.
- Box Size and Grid Orientation: The lower part of the data file lists the results of each box count according to grid calibre and location (see also generating raw data). Here you can find a list of all the box sizes actually used, as shown in a partial list in the screen shot. The list under "DATA" then "Box Size1" tells us that box sizes of 2 and 4 were used at grid orientation 1, for instance; the rest of the list is not visible in the screen shot but would be in a full data file.
- The first two columns in the top section are explained next. To find out about the other headings in the top and each column of data in the bottom, go to Interpreting Results.
-
File+Slice
- Determine exactly where FracLac scanned: In the top part of the file, the first line tells the name of the image and the slice number (S1 in this case because the test image had only 1 slice). Then the area on the image that was considered is indicated. In the test image example, the ROI was the whole image, so it is indicated as at 0,0, and equal to the width and height of the image - 3438 pixels each. The values that follow (e.g., 68,46--3401,3379 for the first line) are for the grid location. For the test image shown here, the largest grid was started at x=68 and y=46, and extended to x=3401 and y = 3379. The actual sizes of the boxes in each grid are listed in the lower part of the data file.
-
Fractal Dimension (D)=regression slope[ln (F)/ln(ε)]
- Interpret some basic results: The first column of data after the title column lists the DB from each location. The theoretical DF for the test image - an 8-segment quadric fractal that scales by 1/4 - is 1.50. In the screen shot shown here, the values are 1.5249, 1.511, 1.5016, and 1.507. As you will read about below, the mean DB is calculated in the Results file. You may have gotten slightly different results depending on the number of grid locations.
-
File+Slice
- A FracLac Box Counts Results window also appears, showing data summarized over all grid locations, including different types of DB and lacunarity. The first three columns are outlined here, but you can learn more about the Results file by going to Interpreting Results.
- Is there an "average" location? The File+Slice column in the Results file is similar to the same column in the Data file. It lists the image file's name and the slice number followed by coordinates for the part of the image scanned and the location of the grids. However, because the Results file averages data over multiple locations (4 in this tutorial), only the first location scanned is listed.
- Did I assess white pixels or black pixels? The second and third columns in the summarized Results file report the number of pixels assessed. The user can tell FracLac to use white or else black as foreground in a binary scan, so the "foreground pixels" reported are the pixels that were deemed as such in the options panel. In the tutorial, the default was left to let the program choose what colour is foreground and what colour is background. In general, the algorithm calls foreground white if there are more black than white pixels, and black if there are more white than black pixels. In this instance, foreground pixels were 257,680 and background 11,819,844, so we know that the lesser in our white on black test image was used as foreground (i.e., foreground pixels were the white ones).
- What was the basic result? The third column reports the mean Fractal Dimension. It is the average over all of the grid locations. Owing to rounding errors, sometimes the mean calculated from the Data file is not identical to that reported in the Results file. In addition, the third column in the Results file reports an unadjusted DB but other values are reported in other columns in the rest of the Results file. See the glossary for more about different types of DB reported by FracLac.
-
What is the graphic about? An image showing the convex hull and bounding circle and another Results Window titled Hull and Circle Results also appear.
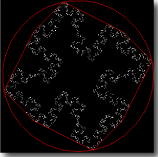 The graphic showed up because it was selected by default, but it can be turned off by unchecking the boxes for circularity and the convex hull in Step 3. Various metrics related to the hull and circle (e.g.,circularity, perimeter, span ratio, etc.) are listed in the Hull and Circle Results file; you can learn more in the Glossary and elsewhere in this manual, too. You can save the graphic by selecting it then choosing File»SaveAs from the ImageJ menu or learn more in the saving tutorial.
Frequently Asked Questions
Scan Image
What is the Scan Current Image or ROI button for?
This button uses the current scan settings and immediately scans the current image or stack or if an ROI is selected, creates a copy of the roi and scans it.
Scan ROI Manager
What is the Scan ROI Manager button for?

 This button uses the
current scan settings
and any ROIs stored in the
ImageJ RoiManager, and scans the current
image or stack using those ROIs. If there are no
ROIs in the RoiManager, then a popup appears letting you
know that it is empty and the scan is stopped.
This button uses the
current scan settings
and any ROIs stored in the
ImageJ RoiManager, and scans the current
image or stack using those ROIs. If there are no
ROIs in the RoiManager, then a popup appears letting you
know that it is empty and the scan is stopped.
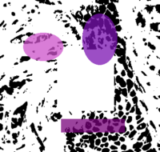
The image shown here illustrates a scan using two oval ROIs and one rectangular ROI stored in the RoiManager. The different colours show that the fractal dimension for each ROI was different. To generate colour-coded images, select the colour-coding option in the FracLac setup panel for the scan you are doing.
Batch
What is the Batch button for?
The BATCH (or SELECT FILES in older versions) button is an alternative to the SCAN button and the RoiManager button.
- Use
this button to
- scan an image file stored on your hard drive without having to have it currently open.
- select multiple image files in one directory, and analyze them as a batch job during which you can select the option to save the data and graphics results files automatically without viewing them on the screen.
See the Batch Job Tutorial
What does the Close Windows Button on the FracLac Panel do?
This button closes without saving all open windows, including images, data, and graphs. This button is handy when many files have been generated and you do not want the data and graphics, but should be used with caution. For previously saved graphics, you will be asked to cancel, but ALL open data and graphics files will otherwise automatically disappear into the void of nevermore.
Message Text
It indicates the type of scan that is selected and will be used, or else it displays a message telling the user to set one up.
File Extension
What does the Set Saved Data Extension button do?
It brings up a dialog box for the user to type a file extension into. The only two file extensions that are used are ".txt" and ".xls", and FracLac will change any input to one of those two extensions.
NOTE: Using the ".xls" extension does not change the basic formatting and is essentially the same as using the ".txt" extension; the choice is there for convenience and future development.
Help
This button links to the FracLac online help (this html document is part of the online help). The link assumes that the Help File is in the directory called "plugins", in a file called "FLHelp". If the link does not work from within FracLac, you can download and open the help file in your web browser. Depending on the version of FracLac, the link may also go directly to the ImageJ website, to the FracLac folder.
What are the Results?
Graphics, Data, and Raw Data Files
FracLac returns different types of information from each scan type; and within each scan type, it all depends on the particular settings. As you may have seen above, for a regular binary box count, if you select "Show Data", you will get, in addition to the main results table with the fractal dimension and various other parameters, files with the count of boxes and the mass in each each box at each box size. The data and graphics are explained in detail on the relevant page for each scan type, which are listed here but you can also reach using the menu on the left.
Box Counting and Lacunarity
Sliding Box Lacunarity
Multifractal Analysis
Local Connected Fractal Dimension Analysis
Sub Scans
Other Morphometrics