
| Author: | Audrey Karperien (akarpe01@postoffice.csu.edu.au) | ||||
| This plugin, an ongoing project, was initially developed as part of a master's at Charles Sturt University with input from Dr. H. Jelinek and Dr. Alastair Buchan, and code from Thomas R. Roy, University of Alberta. It continues to develop in response to the many suggestions from users and includes inputs from the ImageJ, neuroscience, engineering, programming, etc. communities. For information on how to cite the software and work published using it, see the online guide. | |||||
| Source: | Contained in Frac_Lac.jar, which can be opened using a ZIP utility | ||||
| Installation: | Download Frac_Lac.jar to the plugins folder, or subfolder, restart ImageJ, then run the plugin using the Plugins/Fractal Analysis/FracLac command. | ||||
| Description: | Some patterns - such as contours of biological cells, other biological structures, fractals, and some textures - are difficult to describe using Euclidean measures like diameter or length, but can be quantitatively assessed using measures of complexity. FracLac quantitates such difficult to describe details of morphology represented in binary or grayscale digital images, using mass and box counting fractal dimensions (DBs), multifractal analysis data, lacunarity (λ) data, and some other morphometrics. FracLac also includes MicroMod2015 for ImageJ, for modelling branching structures with fractal features. | ||||
| Support: |
Limited inline help is available (2014)
through a window that comes up when a user
selects any scan type. The help includes a single page search, help hints on hover, and other features
to make the software accessible to the non-expert and explain features in context. Hovering over a component on
the set up dialog shows hints, and right clicking on them loads a page of instructions for the component. This
inline help complements the User's Guide
available online. Contact the team for assistance, suggestions, and bug reports.
A help archive that can be unzipped into the plugins folder where FracLac will access it, is available for download. The 38 page PDF manual for previous versions is still available for download. | ||||
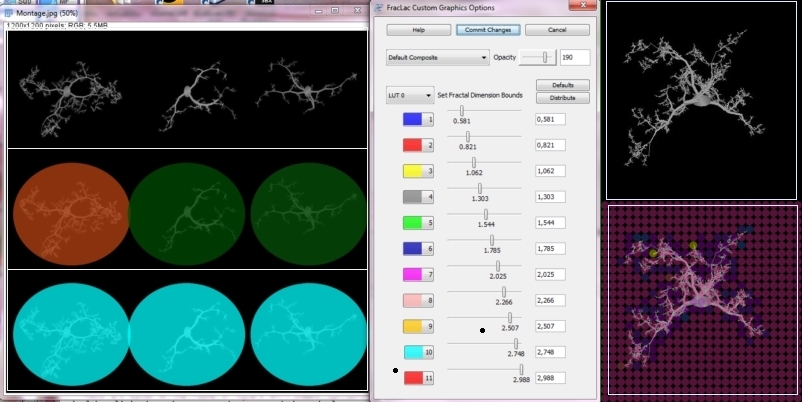
| Features: | FracLac scans images using a shifting grid algorithm that can do multiple scans from different locations on each image, and uses either a nonoverlapping or an overlapping sliding box method. The overlapping method can be exhaustive or not, depending on user choices. FracLac also scans images using an optional rotation function that analyzes an image from several angles and summarizes the results. FracLac automatically generates different types of series of box sizes (e.g., power or linear). In addition, local dimension scans may be done on subareas of either images or rois to show local variation in the DB and λ. These subareas are determined according to the user's choice, using ImageJ's ParticleAnalyzer, a square grid sized according to the user's choice, randomly selected blocks, or individual pixels. Users can view or save the results, and can reapply LUT's to colour coded images or generated text images (see Adjusting LUTs). | ||||
| Use: |
Before images can be analyzed, FracLac has to be set up. This is
usually simply a matter of clicking a button for the type of scan you
want to do, then selecting the defaults in the relevant options panel
that appears, or making modifications if required. Once FracLac has been set up, the type of scan appears at the bottom of the FracLac panel, and buttons to perform scans are enabled, as shown on the screen shot below. Using FracLac, one can do fractal, multifractal, and lacunarity analyses on:
| ||||
| Outputs: |
The information returned by the various types of scans is summarized below:
Data FilesThe measures noted above are reported in data files accompanied by various statistics for the data, including the y-intercept, standard deviation, and coefficient of variation, for instance. Reports generated can be viewed and saved as Results Windows or automatically saved as .txt files (tab-delimited;UTF-8 encoded) to be opened in a spreadsheet. These include: Graphics FilesSome measures are represented in graphics that can be viewed and saved or automatically saved. These include:
| ||||
| Limitations: | FracLac works on
binary images (black pixels on a white background, or white pixels on a
black background) and on grayscale images or grayscale images that have
been converted to RGB. For a binary analysis (e.g., branching patterns
or single pixel wide contours of cellular outlines), the signal is black
or white pixels and the noise is the opposite, white or black pixels,
thus images must be thresholded prior to analysis to ensure that only
the pixels of interest are assessed. For grayscale scans, images and
rois are padded with a value that is ignored by the
counting method. Grayscale scans are suited to textures as opposed to
contours, and assess every pixel as signal, so the region of interest
must be selected carefully. To ensure non-significant parts of grayscale
images are not assessed, the image can be converted to RGB and the
non-significant areas selected with the wand function or filled with a
non-gray value, as is illustrated in the image.
| ||||
| References: |
For details of the calculations, see the FracLac javadoc, which can be generated using the FracLac source code. For more information, the references below are the main ones used in defining the calculations:
| ||||
| History: |
2002/08/26: First version
2002/09/26: Calculates circularity 2003/12/17: Major update 2004/06/30: Updated 2005/03/23: Updated to version 2.0aF 2005/11/24: Updated to version 2.3 2006/03/17: Updated to version 2.3j 2006/05/22: Updated to version 2.4b 2006/11/20: Updated to version 2.4e 2007/03/13: Major update to version 2.5 2007/03/27: Fixes bug that caused no printed and saved results for some scans (2.5a) 2007/04/04: Fixes bug that sometimes prevnted maximum epsilon from changing (2.5b) 2007/07/17: Fixes bugs that prevented box masses from being printed for sliding box lacunarity scans and prevented batches from being processed (2.5c) 2007/08/01: Fixes bug that prevented user from knowing if the number of grid orientations was changed or not; implements user suggestions for multifractal optimization and local connected fractal dimension; help file is now html (2.5d) 2011/02/03: Fixed a couple of bugs with multifractal analysis 2012/04/05: Fixed encoding of autosaved text files so Greek symbols are retained; fixed bug so autosaved files are saved in a date and time stamped folder (2.5g) 2102/04/15: release 2.5i; Fixed saved results file problem so filtered data are saved in separate files; fixed display problem so images are not displayed while being processed; changed grid location algorithm to use a series of grid positions in response to user requests; fixed bug so images having inverted LUTs are filled with the right colour. 2012/04/15: release 2.5i.2; fixed bug so subscans can be done using the particle analyzer again; fixed bug so subscans don't hang on stacks 2012/04/18: 2.5i.3 fixed bug that caused grid position counter to reset with very small box sizes; fixed problem with getting irregular rois 2012/04/30: 2.5k fixed bugs with particle analyzer on inverting LUTs; fixed random mass sampling bug that caused a hang on stacks 2012/05/03: 2.5m fixed bugs with lcfd stacks 2012/05/08: 2.5p fixed bug with regression lines not showing; added feature to let user choose less slices per stack so grid images don't crash 2012/05/13: 2.5r added feature to work on grayscale images with "holes" 2012/06/21: 2.5v fixed bug with multifractal scanner autochanging the number of scans; added mass vs distance feature; updated colour coded image outputs 2012/11/02: 2.5w fixed bug with multifractal scanner to allow user to override minimum box size; changed default for edge effects; fixed grayscale bug with RGB images 2013/28/02: 2013Feb needs jdk 1.7; more compact UI; fixed bug with roi coordinates; updated output files to meet user requests to compare different fractal dimensions in one file and images in another 2013/25/04: 2013Apr jar recompiled for compatibility with jdk 1.6 2013/19/07: 2013Jul Fixed bug causing some data files to be empty in batch mode; updated parts of javadoc; 2013/24/11: 2013Nov Added feature to visualize changes in graphics showing the variation over an image; updated parts of javadoc 2013/04/12: 2013Dec Fixed bug with grayscale scans crashing; fixed batch jobs for subscans; fixed ParticleAnalyzer crashing issue; 2014/22/Mar: 2014Marb765 Added inline help window; fixed bug with colour-coding on screen; fixed bug with incorrect release number appearing on frame 2014/26/Mar: 2014Marb768 fixed bug for loading and saving settings files; changed encoding to utf-8 so symbols are encoded properly in text files 2014/03/Apr: 2014Aprb800 fixed a bug that prevented the user from changing the increment between exponents for multifractal analysis 2014/14/Apr: 2014Aprb804 recompiled to work under IJ 1.48u (in the previous release, the FracLac panel for setting up scans was not appearing in IJ 1.48u) 2014/17/Apr: 2014Aprb1012 fixed problems with the set up frame not appearing and sliders on the set up frame not working 2015/07/Jan: 2015Janb1292 Fixed problems with colour-coding dialog; added wave data processing functions. 2015/12/Jan: version 2015Janb2594 Fixed multifractal analysis ƒ(αQ) graphs; updated some icons. 2015/15/Jan: version 2015Janb2702 In response to a user request, it now generates an additional file with multifractal data separated according to datatype for comparing images. 2015/17/Jan: version 2015Janb3079 Updated help file for multifractals. Fixed problems with q-inc and q-array maker that were preventing multifractal apertures from being drawn. Included data file for multifractal analysis that describes the multifractal scaling to complement the multifractal spectra data files. Multifractal spectra plots now save as a stack for unoptimized samples. 2015/02/Feb: version 2015Febb4135 Fixed bugs in multifractal optimizer and data files so now the data set prints when the option for both optimizing and showing all is selected; fixed bug where plots were not saving for some filenames; included slice labels in data files if available as per user request. 2015/18/Feb: version 2015Febb5699 Fixed new bugs in multifractal optimizer and data files as per user request so individual file name is included on the plot. Fixed colour-coding bug so grayscale "replace foreground pixels" option works. Fixed random sample bug that made this option crash on grayscale scans. 2015/27/Feb: version 2015Febb5810 Fixed multifractal ƒ(αQ) options dialogue so now the user can choose to print or not print optimizing data on the graph. 2015/08/March: version 2015Marb6206 Fixed "OK" button; fixed slider bugs; fixed problem with inverted LUTs in batch mode so they are now processed the same as in screen mode. 2015/07/April: version 2015Apra4308 Added rotation function and integrated MicroMod for ImageJ. 2015/06/July: Fixed bug with loading multiple custom files in MicroMod for ImageJ; fixed bug with rotations in results file. 2015/15/Sept.: Fixed bugs in MicroMod and multifractal rotator. |
![[cs]](cs.jpg)
![[panel]](panel.jpg)
![[coded]](coded.jpg)
![[mf]](mf.jpg)
![[texture]](texture.jpg) You should assess your analysis against benchmark images and be aware of
how the settings can affect the result. For instance, FracLac will
determine the fractal dimension of a 400 x 400 pixel square as a perfect
1.000 (not fractal at all but the correct value) if the software is set
to use a scaled series with a scaling factor of 2, a minimum box size
of 25, and a maximum box size of 50%. But for most images, the point of
the analysis is to determine a value for the fractal dimension without
knowing the scaling ahead of time. See the online help for more about
this.
You should assess your analysis against benchmark images and be aware of
how the settings can affect the result. For instance, FracLac will
determine the fractal dimension of a 400 x 400 pixel square as a perfect
1.000 (not fractal at all but the correct value) if the software is set
to use a scaled series with a scaling factor of 2, a minimum box size
of 25, and a maximum box size of 50%. But for most images, the point of
the analysis is to determine a value for the fractal dimension without
knowing the scaling ahead of time. See the online help for more about
this.