| Authors: |
Jie Shu (The University of Nottingham, UK) psxjs3@nottingham.ac.uk
Guoping Qiu (The University of Nottingham, UK) Guoping.Qiu@nottingham.ac.uk Mohammad Ilyas(Queens Medical Center NHS Trust, University of Nottingham, UK) Mohammad.Ilyas@nottingham.ac.uk |
| History: |
2014/Apr/28 : First version |
| Requires: | ImageJ 1.40p or later, downloaded from ImageJ |
| Source: | In IHC_Toolbox.jar |
| Dataset: |
Nuclei Dataset: Include 52 images of 200x200 pixels. They are captured
from Diaminobenzidine (DAB) stained Tissue Microarray (TMA) images
and Wholes Slide (WS) images. These images contain severely clustered
nuclei. You can download this dataset from Nuclei DATA.
Gland Dataset: Include 20 images of 1280x1024 pixels. They are captured from DAB stained TMA images and WS images. These images contain normal glands and tumor glands. You can download this dataset from Gland DATA. |
| Installation: | Drag and drop IHC_Toolbox.jar to the "ImageJ" window or download and install using the Plugins>Install command. |
| Description: | We developed this toolbox using a semi-automatic scheme that is suitable for different kinds of IHC image analysis. It can detect the basic components in an IHC image and is useful for researchers to then do further analysis.The user created models and parameters can be saved and transferred to different users for the reproduction of detection results in different laboratories. The functions contained in this tool are semi-automatic color selection, automatic statistical color detection, automatic nuclei segmentation and automatic gland detection (locating bounding boxes to the candidate glands and required further classification, such as Support Vector Regression (SVR)). |
| User manual: |
For the Color Detection, the functions of semi-automatic color selection and
automatic statistical color detection model are combined together. color selection
is used to select and reserve the positive color pixels while the background
color pixels are eliminated (set to be 255). Then, the statistical color
model is created based on the histogram of these reserved positive color pixels. The automatic Nuclei Segmentation is implemented on the detection of positively stained nuclei in DAB stained images. Especially for the separating of severely clustered nuclei. The pre-defined parameters include window size is 25x25 (half size of nuclei) pixels, the minimum size constraint is 150 pixels and the final size constraint is 150 pixels. These parameters are set for the segmentation of clustered nuclei in our created dataset, the Nuclei Dataset. You can customize these parameters according to your datasets. The Gland Detection can automatically detect the candidate gland strucutres in the IHC image. You can save the generated file in .txt format and name it as you wish, for example, sample1.txt. This file contains the topleft and bottomright coordinates of detected bounding boxes. The final result image contains these bounding boxes and can be combined with original image through ImageJ Process, Image Calculator, Operation: AND or XOR. |
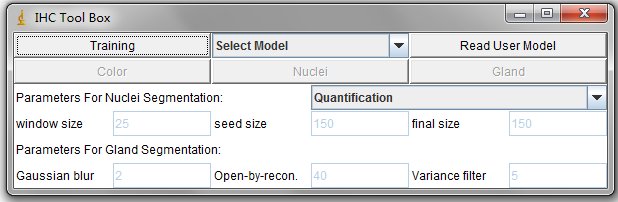
There are 5 Buttons in the interface, such as Training, Read User Model, Color, Nuclei and Gland. And the dropbox Select_Model. These functions are descripted as follows.
The Training Button are used to select and filtered out the undesired color pixels (illustrated in the following training process).
The Drop box can read the system pre-defined model, for example, the H-DAB color detection model.
The Read User Model Button can read the users defined models.
The Color Button can detect the stain color based on the read color model.
The Nuclei Button can do segmentation and quantification on positive nuclei. The positive nuclei are determined by the read color model.
The Gland Button can export a txt file which contains the topleft and bottomright coordinates of candidate glands.
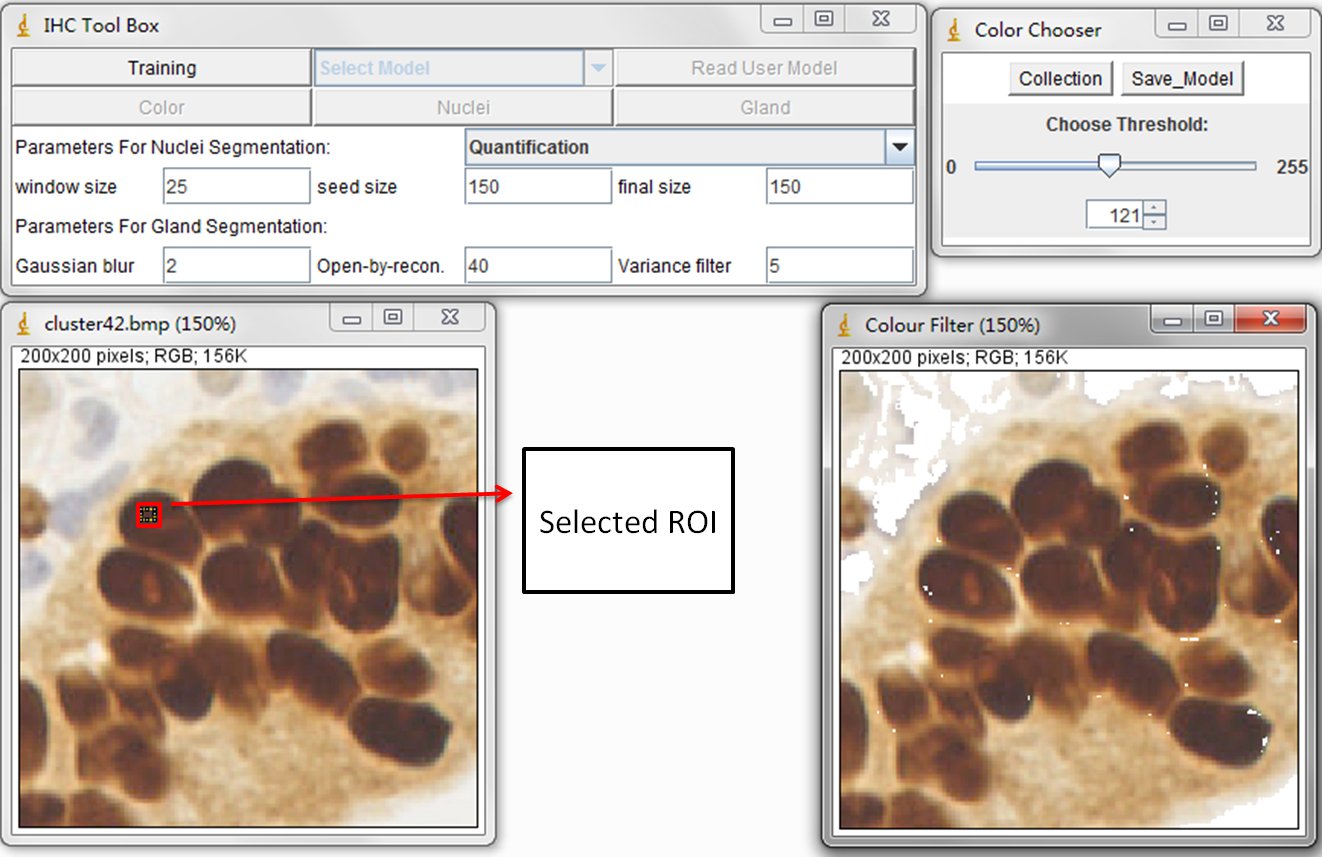
This training process is to train the statistical color detection model based on visual selected color pixels. You can start training by selecting a Region of Interest (ROI) through a rectangular tool in imageJ and pressing Training button on main panel.
The left image is original DAB stained color image and the right image is the result image. Using the sliding bar presented in sub-panel (color Chooser), you can visually determine the reserved color pixels in the result image. Once all the desired color pixels of an image are reserved, you can record them by pressing Collection button in color Chooser panel. The model is then automatically calculated and created. In general, the training phase requires re-selecting the ROI on multiple training samples in order to obtain a wide range of shades of the target color. You can close the collected image and re-open a new one. When a new training image is added, the model is then re-calculated automatically based on the accumulated histograms.
At the end of collecting training samples, the created statistical model can be saved (Using Save Model button in color Chooser panel) and reused for subsequent detection. It is recommended to save the model as the .txt format. Please see those models we created in the Modelfolder. These model files are pre-defined color model for the detection of DAB stained brown color, brown color in elastin contained liver samples and Sirius Read (SR) stained pink color. Users can define their own models throung the Training step and put them in User Model folder.
By selecting those models or changing a new one, you can press the button Read User Model on the main panel to read them one by one. The Read Model button is set to read the default model H-DAB.txt for brown color detection.
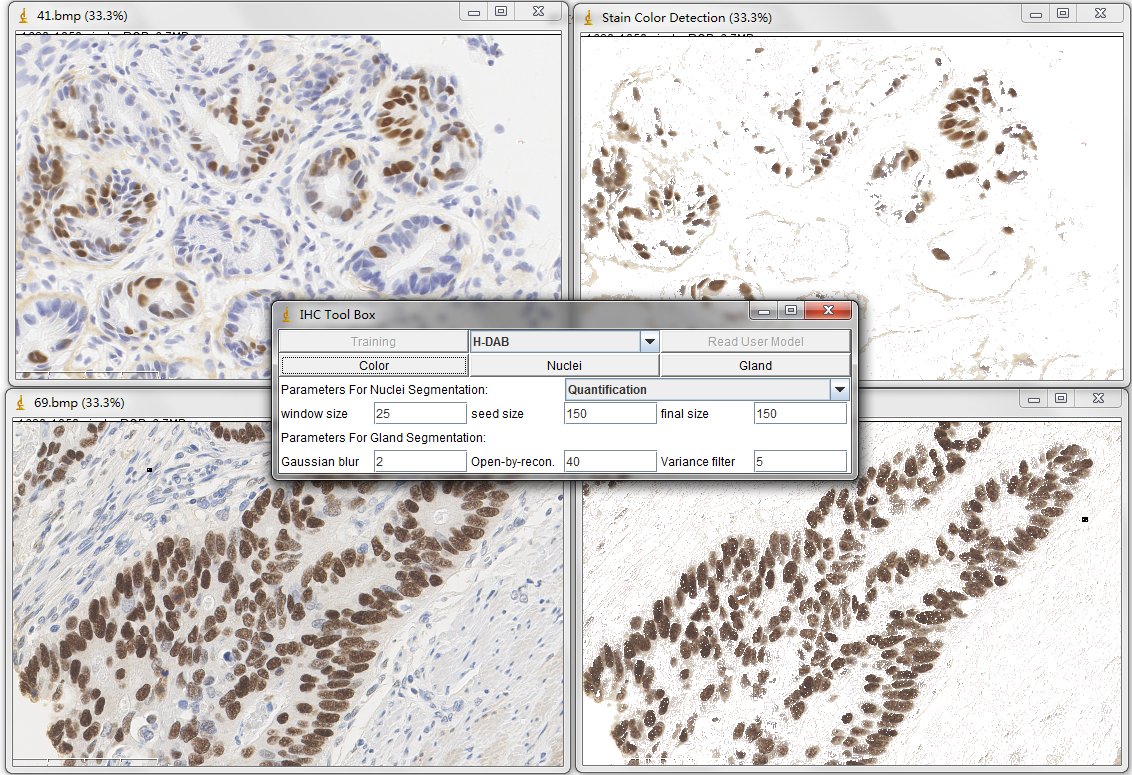
Once you have read one color detection model (for example, the H-DAB. txt), simply press the Color button on the main panel. Then the tool will generate the detected result in a created new window.

For the nuclei segmentation and quantification, you can set those parameters before you press Nuclei button. The quantification consists of counting the positive nuclei and oval fitted nuclei segmentation. Instead, the contour is drawn at the edge of the detected positive nuclei. Unless customized parameters are set, this nuclei segmentation and quantification functions are automatically processed. Changing between the processes of Quantification to Segmentation, you can select the order through the drop-down menu.
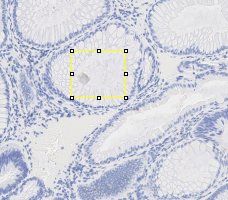
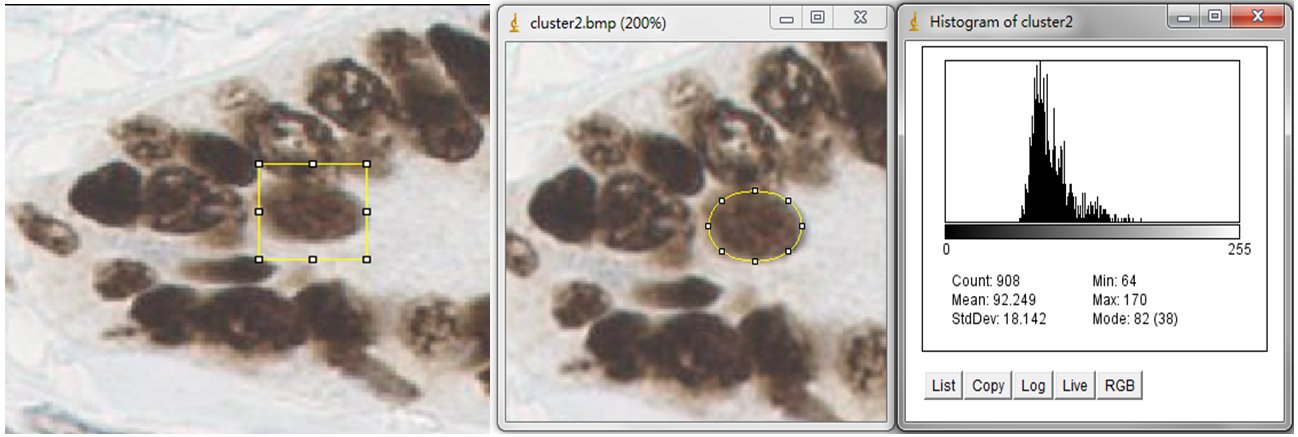
In order to estimate the parameters for nuclei segmentation, you can use the square tool and ellipse tool in imageJ. The image on the left is fitted by a 44x44 square, and the image on the right is fitted by an ellipse that has 908 pixels inside. For the window size parameter, it is better to set as 25 pixels (half size of the window) which may cover the sizes of all nuclei. And the seed size, corresponding to the minimum size constraint, should be the half of small nucleus. In our dataset, the size of nuclei changes from 300 to 900 pixels, where we set 150 pixels as seed size.
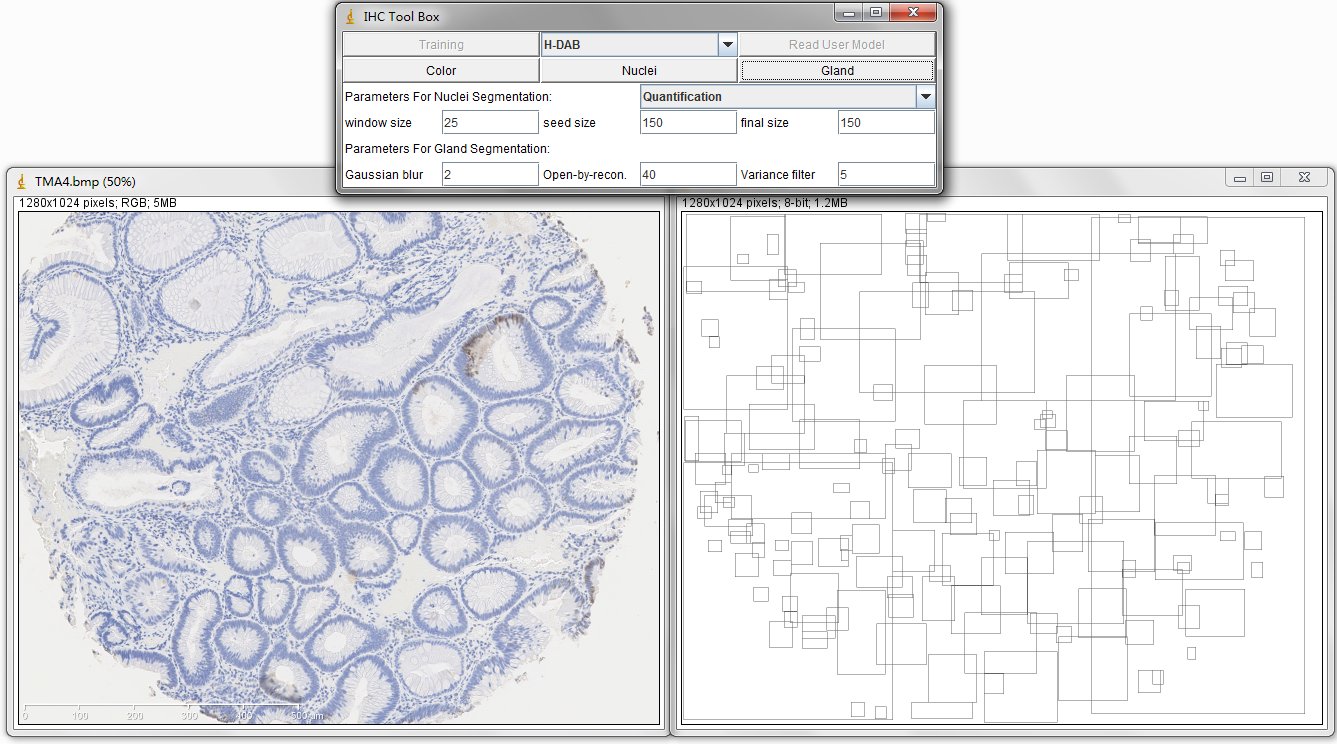
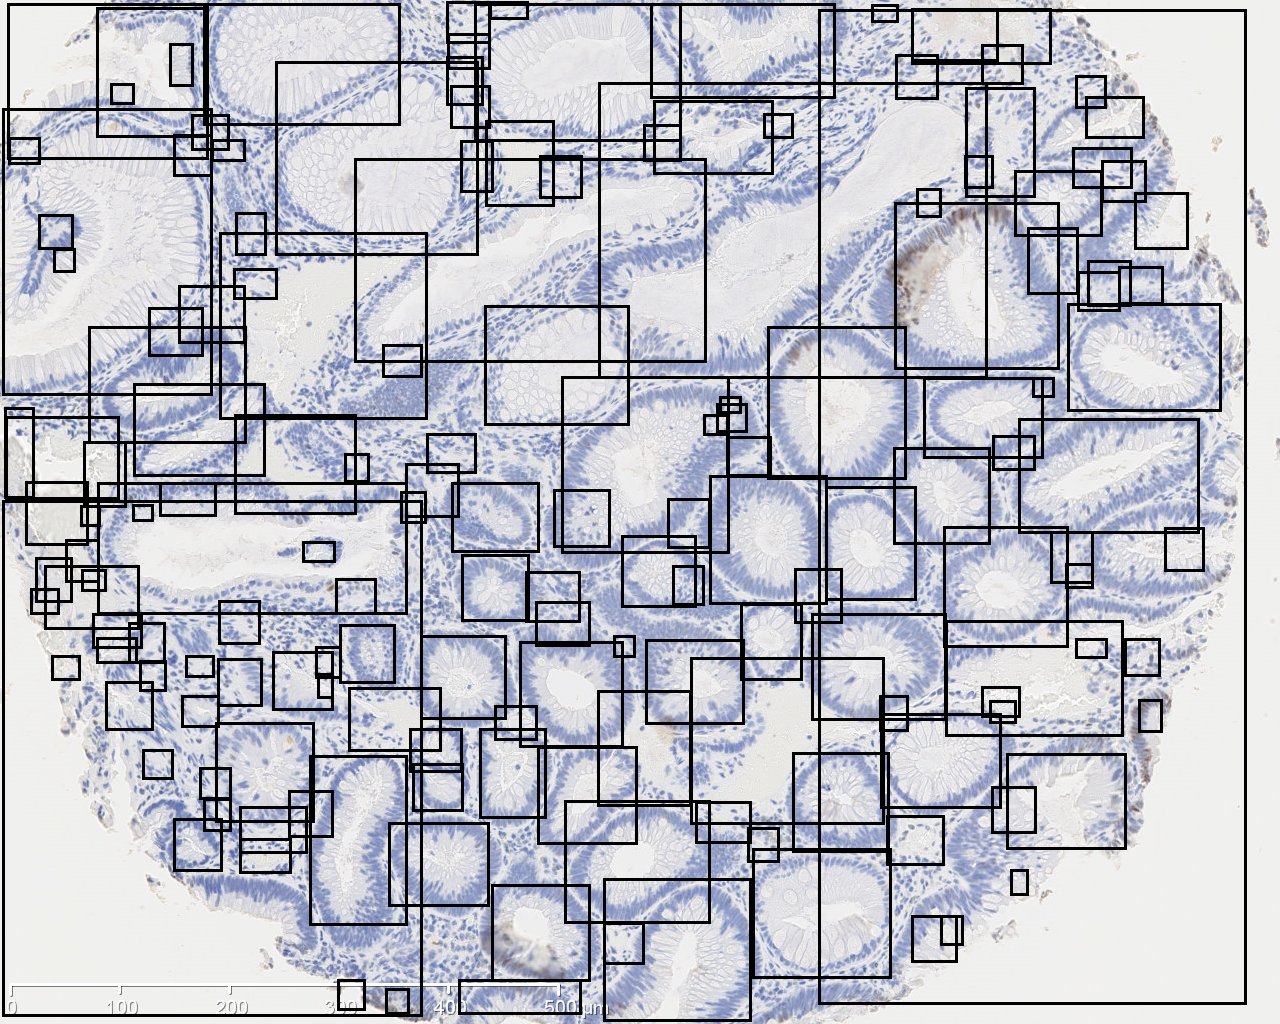
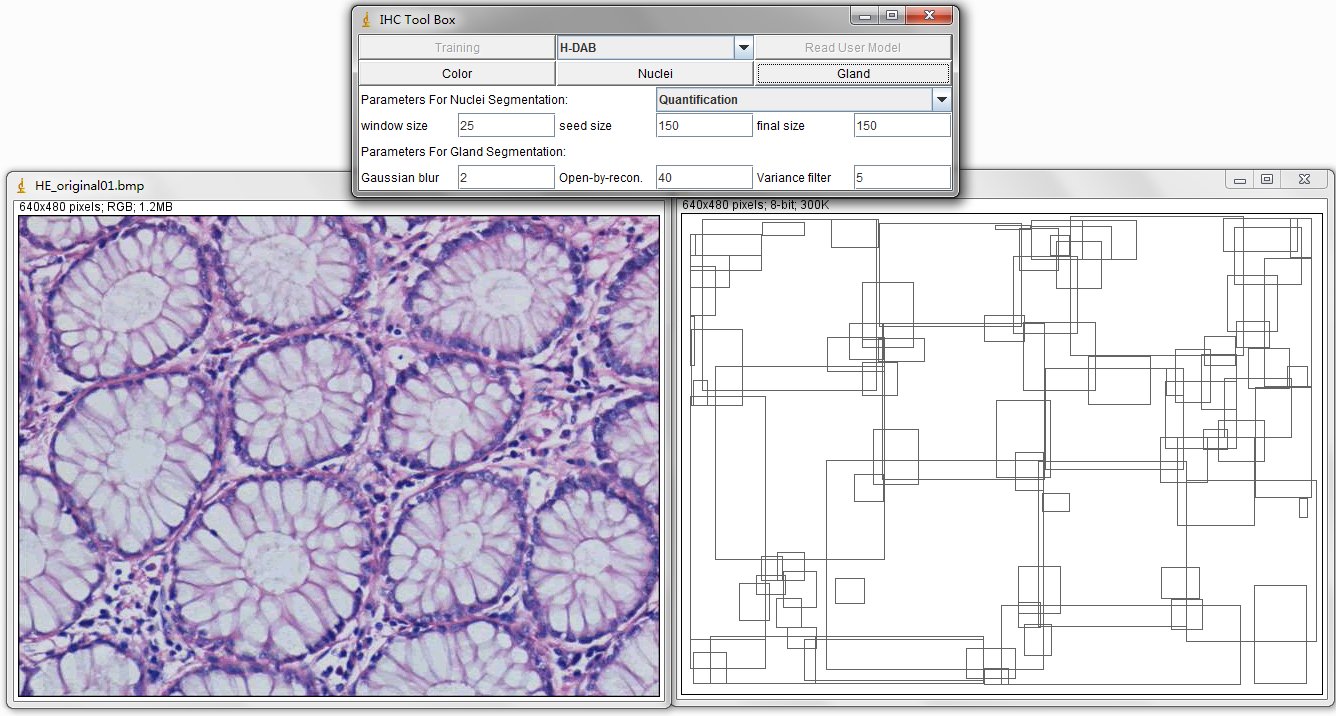
The image on the left is original IHC image, and the image on the right contains the bounding boxes for detected candidate gland strucutres. And there will generate a txt file which you can save it and name it as you wish, for example, "sample1.txt". This file contains the topleft and bottomright coordinates of detected bounding boxes. The final result image are those bounding boxes and can be joint with original image through ImageJ Process->Image Calculator-> Operation:AND.
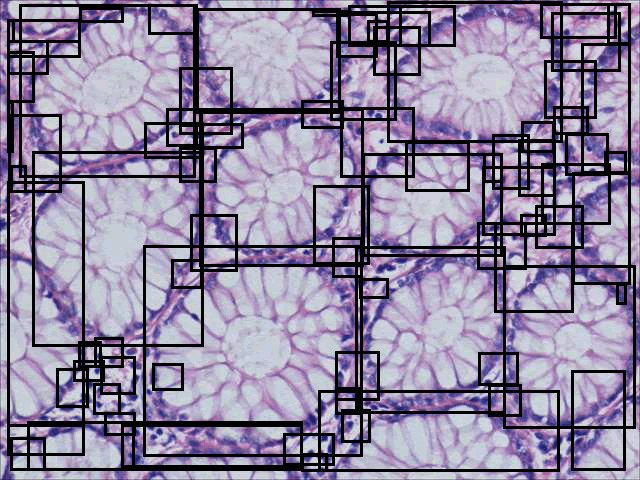
In order to estimate the parameters for gland detection, you can use the square tool in imageJ. The square fitted in the example gland is 108x94. The open-by-reconstruction radius is depending on the size of inner gland area. We set an average radius 40 pixels for our dataset. The radiuses of Gaussian blur and variance can be changed according to the specific environment. In addition, this gland detection method can be applied to H&E stained images as well, for example
References:
Biomarker Detection in Whole Slide Imaging Based on Statistical Color Models Jie Shu, Guoping Qiu, Mohammad Ilyas and Philip Kaye. Biomarker Detection in Whole Slide Imaging Based on Statistical Color Models. The MIDAS Journal- Computational Imaging Biomarkers for Tumors (CIBT), http://www.midasjournal.org/browse/publication/758, 2010 A Semi-Automatic Image Analysis Tool for Biomarker Detection in Immunohistochemistry Analysis Jie Shu Guoping Qiu, Mohammad Ilyas, G. Dolman. A Semi-Automatic Image Analysis Tool for Biomarker Detection in Immunohistochemistry Analysis. International Conference on Image and Graphics (ICIG). pp. 937-942, 2013 Segmenting Overlapping Cell Nuclei in Digital Histopahology Images Jie Shu, Guoping Qiu, Philip Kaye and Mohammad Ilyas. Segmenting Overlapping Cell Nuclei in Digital Histopahology Images. 35th IEEE Engineering in Medicine and Biology Society (EMBC). pp. 5445-5448, 2013 An Efficient Gland Detection Method Based on Texture and Morphological Transformation Jie Shu, Hao Fu, Guoping Qiu and Mohammad Ilyas. An Efficient Gland Detection Method Based on Texture and Morphological Transformation. Medical Image Understanding and Analysis (MIUA). pp. 173-178, 2013