| Authors: |
Eduardo Moura, Federal University of Campina Grande, Brazil. (eduardosmoura
at gmail.com)
Arnaldo Sena, Federal University of Campina Grande, Brazil. (arnaldoufcg at
gmail.com)
Herman Gomes, Federal University of Campina Grande, Brazil. (hmg at
dsc.ufcg.edu.br)
This plugin has been created as part of the methodology for mandibular
asymmetry analysis proposed by Alexandre Durval Lemos in his PhD work,
developed at the School of Dentistry, Department of Social Dentistry,
Pernambuco state University, Brazil, with the collaboration of Cintia Regina
Tornisiello Katz, Mônica Vilela Heimer, Aronita Rosenblatt, and Denise
Nóbrega Diniz.
|
| Description: |
This plugin is designed to produce mandibular asymmetry measurements from
dental panoramic radiographs.
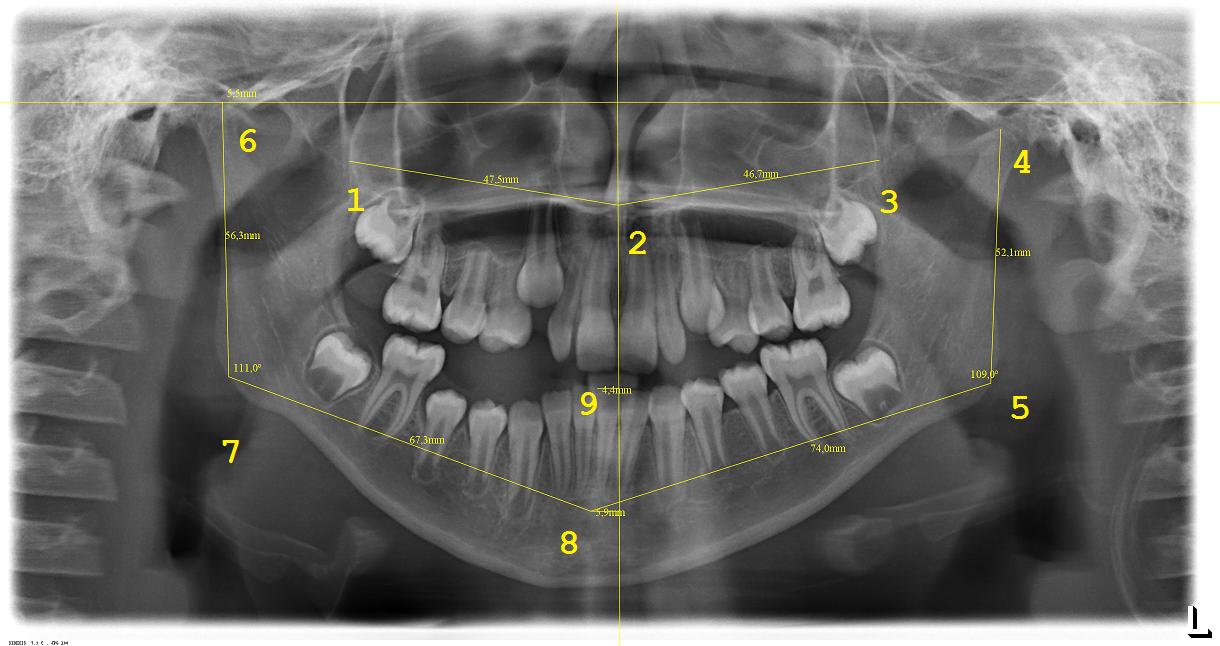
Nine anatomic points should be indicated in sequence directly on the dental
panoramic radiograph image using the ImageJ POINT TOOL, from which angular
and linear measurements can be automatically calculated.
Measurements
- Angular Measurement
- Gonial Angle (GA): formed between CH and CL on
both sides; results expressed in degrees.
- Linear Measurements
- Ramus Height (RH): distance between the most cranial point of the
condyle (points 4 and 6, as described by Deleurant et al.15) and the gonion
(points 5 and 7);
- Corpus Length (CL): distance between gonion (Go) and pogonion
(Pg); the gonion was defined as a random midpoint on the posterior curvature
of the mandible (intersection points between corpus and ramus);
- Pg-MSP: distance between pogonion and median sagittal plane,
represented by a horizontal link connecting the Pg to the plane;
- IP-MSP: distance between IP and MSP, represented by a horizontal
line connecting the IP to the plane;
- CHD: difference between the heights of the right and left condyle
(beginning with most superior to the most inferior position; represented by
a horizontal line automatically drawn from the CH point of the taller
condyle, proceeding to the contralateral side for a better visualization in
relation to the opposing condyle.
Operation
- Start ImageJ and open a dental panoramic x-ray image;
- Select ImageJ STRAIGHT LINE tool and trace the mesio-distal length of
one of the incisors (for example, tooth 11) the measurement (in
millimeters) is previously known through a clinical exam or study model;
this step is necessary for the calibration of the image and conversion of
measurements from pixels to millimeters;
- On the menu bar, click on ANALYZE and select SET SCALE tool: enter known
distance (measurement of length of tooth 11 in mm), change length unit to mm
and select GLOBAL SCALE option (this option is only valid for images with
the same resolution; if the researcher needs to evaluate images with
different resolutions, this step will need to be carried out on each image
individually);
- On the menu bar, click on Plugins and select Lemos Asymmetry Analysis;
- Choose whether or not to use a distortion factor (Yes/No). If choosing
Yes, left and right distortion factors (LDF and RDF) will be considered.
This is important because on panoramic radiographs, measurements of the
mandibular corpus may have some inaccuracy because of distortion. Vertical
measurements are considered to be less affected by the possible change in
the positioning than horizontal and oblique ones.
- In case a distortion factor should be used: trace the mesio-distal
length of one of the molars (for example, tooth 16); press F8 and then
select the chosen tooth on the popup window is shown. The same process
should be performed for the molar teeth(teeth 26, 36, 46).
- On the tool bar, click POINT TOOL with the right button of the mouse
and define the MULTI-POINT TOOL option as the standard;
- Left click the mouse to choose points 1 to 9 (as indicated in the
figure below) in sequence; the lines are automatically drawn by the program;
at the end of the operation, a spreadsheet is opened with all measurements
ready for analysis;
- To conclude the analysis with a distortion factor (items 5 and 6
above), press the F9 key to insert the molars mesio-distal length (in
millimeters) previously known from the clinical exam or cast model. After
this step, the measurements are automatically shown on a spreadsheet that
can be saved to disk;
- After defining the 9 interest points, any of the points can be
adjusted with the left mouse button. By pressing the F10 key, the updated
measurements are shown on a spreadsheet that can be saved to disk. Note that
this will not consider any previously set distortion factor - if
measurements with distortion factors are needed after changing the point
positions, restart the plugin after saving the marked points and global
calibration (using the F12 key, see item 12 below) and follow steps 5, 6 and
9 above;
- The image with the overlayed measurements can be saved by pressing the
F11 key;
- The points and global calibration can be saved by pressing the F12 key
(this will save a text file with the same image name and a .txt extension,
which can be automatically loaded for a future analysis).
|